 Smart Cities

Measuring Shade: How Arizona Cities Can Prove Their Heat Mitigation Investments Are Working
Smart Cities
Published by IOT Arizona Research & Editorial Team
- Air Temperature Is the Wrong Scoreboard
- Models Are Getting Better, but They Need Ground Truth
- A Sensor Network Designed Around People
- Design the Evaluation Before Installing Anything
- Cooling Centers: Measuring Access, Not Just Existence
- Transit Stops Are Where Heat Policy Meets Daily Life
- Turning Readings Into Decisions
- Practical Challenges Arizona Cities Will Face
- Starting Small Is Fine
- Partnerships Arizona Already Has
- Where Smart City Heat Work Is Going
Phoenix has spent years building one of the most ambitious urban heat programs in the country. It created the nation's first publicly funded Office of Heat Response and Mitigation in 2021, adopted a Shade Phoenix Plan, and set a goal of 100 Cool Corridors by 2030, each planted with roughly 200 trees along pedestrian and transit routes. Tempe, Tucson, Mesa and other Arizona cities have launched their own shade, tree and cool surface initiatives.
Yet 2026 has been brutal. By September 8, Maricopa County had confirmed 150 heat-related deaths for the year, 97 percent more than at the same point in 2025, with many more deaths still under investigation. That contrast raises a hard question for city leaders, council members and the public: which heat investments are actually reducing exposure for the people most at risk, and how would anyone know?
This article argues that the next phase of smart city work in Arizona is not more dashboards. It is measurement designed to answer that question, using sensor networks built around how heat affects bodies at street level.
Air Temperature Is the Wrong Scoreboard
Most public heat data reports air temperature, usually from an airport or a sparse network of weather stations. But the heat a person feels while waiting at a bus stop on a summer afternoon depends heavily on radiant heat: sunlight hitting the body directly, plus heat radiating up from pavement and off nearby walls. Researchers often summarize this with mean radiant temperature, which can run far above air temperature in full sun.
This matters because many mitigation strategies work mainly on radiant heat. A shade structure may barely change the air temperature beneath it while dramatically reducing what a person experiences. The Tree Equity Score project notes that shade can reduce heat burden by up to 50 percent. A modeling study of a Phoenix neighborhood found that raising tree canopy from 10 to 25 percent could cut near-ground air temperature by up to 2.0 degrees Celsius, while cool roofs on homes produced about 0.3 degrees. Air temperature alone would make shade look far less valuable than it is.
If cities evaluate shade with air temperature sensors alone, they will undercount the benefit of their best tools.
Models Are Getting Better, but They Need Ground Truth
Phoenix already uses sophisticated modeling. The Office of Heat Response and Mitigation has worked with a 3D model of the city to estimate shade from buildings and trees at different times of day, and publicly available Tree Equity Score maps include shade layers for noon, 3 p.m. and 6 p.m. These tools are valuable for deciding where to plant and build.
Models, however, estimate conditions. They cannot tell a city whether a newly planted corridor is surviving its first summer, whether a shade sail is oriented correctly at 4 p.m., or whether a cool pavement coating is still performing after two years of traffic and dust. That is where carefully placed sensors come in.
A Sensor Network Designed Around People
| Measurement | Why It Matters | Where to Place It |
|---|---|---|
| Air temperature and humidity | Baseline conditions and comparison with regional weather data | Shaded, ventilated housings at pedestrian height |
| Globe or radiant temperature | Captures the radiant heat people actually experience | Bus stops, sidewalks, playgrounds, both shaded and unshaded |
| Surface temperature | Evaluates cool pavement, coatings and ground cover | Paired treated and untreated surfaces on the same street |
| Solar exposure | Confirms whether shade actually falls where planned at key hours | Under shade structures and new tree plantings |
| Anonymous occupancy counts | Shows whether people use cooling centers, shaded stops and hydration stations | Cooling centers, transit stops, park amenities |
Placement is the most important design choice. Sensors belong where vulnerable people spend time outdoors: transit stops on long routes, walking paths to schools and clinics, and areas near shelters and encampments. A sensor on a municipal rooftop is convenient to maintain but tells planners little about human exposure.
Design the Evaluation Before Installing Anything
Measurement only proves impact if the study design allows comparison. Arizona cities can build evaluation into projects from the start with a few practical principles:
- Measure before the intervention. Install sensors at least one summer before planting trees or building shade so there is a baseline.
- Use matched comparison sites. Pair each treated location with a similar untreated one nearby, so weather differences between years do not distort results.
- Focus on the hottest hours. Late afternoon, when radiant heat and pavement temperatures peak, is usually when mitigation matters most.
- Track survival and maintenance. Young trees need years to provide meaningful shade. Monitoring irrigation and tree health protects the investment.
- Publish the results. Open data builds public trust and lets neighboring cities learn from each other.
Cooling Centers: Measuring Access, Not Just Existence
Maricopa County's Heat Relief Network has long faced a structural gap: many sites operate during normal business hours, leaving late afternoons, evenings and weekends underserved. Phoenix's 2026 Heat Response Plan responded by extending hours at the Cholla Library cooling center to 9 p.m. daily and adding Sunday capacity, targeting elevated heat risk along the I-17 corridor north of downtown.
Connected data can make those decisions sharper. Anonymous people counters show when centers fill and when they sit empty. Combining visit patterns with heat forecasts, transit schedules and outreach data can help cities decide where extended hours or new sites would do the most good. Privacy matters here: counts should be anonymous, and no system should identify individuals seeking relief.
Transit Stops Are Where Heat Policy Meets Daily Life
Many heat-vulnerable residents rely on buses, which means waiting outdoors in the hottest part of the day. Instrumenting a sample of stops with radiant temperature sensors, and comparing stops with and without shade, gives transit agencies and cities concrete evidence for prioritizing shelter upgrades. Real-time arrival information also helps: knowing a bus is 15 minutes away lets a rider wait in a nearby shaded or air-conditioned space instead of standing in direct sun.
Turning Readings Into Decisions
Data only matters if it changes what a city does. A few examples show how measured heat can shape budgets and priorities:
- Choosing between shade types. If radiant measurements show that a shade sail over a bus stop cuts afternoon heat almost as much as mature trees, while trees on that corridor struggle to survive, the city can adjust its mix of structures and plantings.
- Timing maintenance. Surface temperature trends can reveal when a cool pavement coating has lost effectiveness and needs renewal.
- Protecting young trees. Soil moisture sensors on new plantings help irrigation crews focus water on trees at risk of dying in their first summers, protecting the long-term shade investment.
- Targeting outreach. Neighborhood heat readings combined with public health data can guide where outreach teams, water distribution and wellness checks go during extreme heat warnings.
Practical Challenges Arizona Cities Will Face
- Sensor survival. Extreme heat degrades batteries and electronics, while dust storms and monsoon rain test enclosures. Choose hardware rated for high temperatures and plan for replacement cycles.
- Vandalism and theft. Mount sensors on existing poles with tamper-resistant hardware, and budget for some losses.
- Data consistency. Different vendors and sensor types produce readings that are hard to compare. Standardize equipment and calibration across programs.
- Maintenance funding. Grants often pay for installation but not upkeep. Build multi-year operating costs into budgets from the start.
- Equity in placement. Networks tend to cluster where installation is easy. Deliberately prioritize neighborhoods with the highest heat vulnerability and lowest existing canopy.
Starting Small Is Fine
Cities do not need hundreds of sensors to begin. A pilot of 20 to 40 well-placed stations along one planned cool corridor and a comparison route, installed a year before planting, can generate credible evidence within two summers. The key is disciplined design, consistent equipment and a commitment to publish what the data shows, even when results are mixed. A modest pilot that answers one clear question is more useful than a large network nobody analyzes.
Partnerships Arizona Already Has
Arizona cities are well positioned for this work. Universities in Tempe and Tucson have deep expertise in urban climate research, and community organizations know where residents struggle most. County public health departments hold the heat mortality data needed to connect exposure to outcomes. Local IoT and telecommunications companies can supply and maintain networks. Pairing these partners around a shared measurement framework would give the region some of the strongest evidence on urban heat mitigation anywhere.
Where Smart City Heat Work Is Going
Several trends will shape the next few years: higher-resolution satellite surface temperature data, lower-cost radiant temperature sensors, and integration of heat data with transit, public health and emergency management systems. The most meaningful change, though, may be a shift in what cities count as success, from trees planted and miles coated to measurable reductions in the heat people experience where they live, wait and walk.
Phoenix and its neighbors have already done the hard work of committing to heat mitigation. Proving what works, and redirecting resources toward it, is the logical next step. Cities and agencies looking for sensor network partners can explore the IoT Arizona company directory, including providers serving Phoenix.
Tags:
Related articles
Smart Cities
 Smart Cities
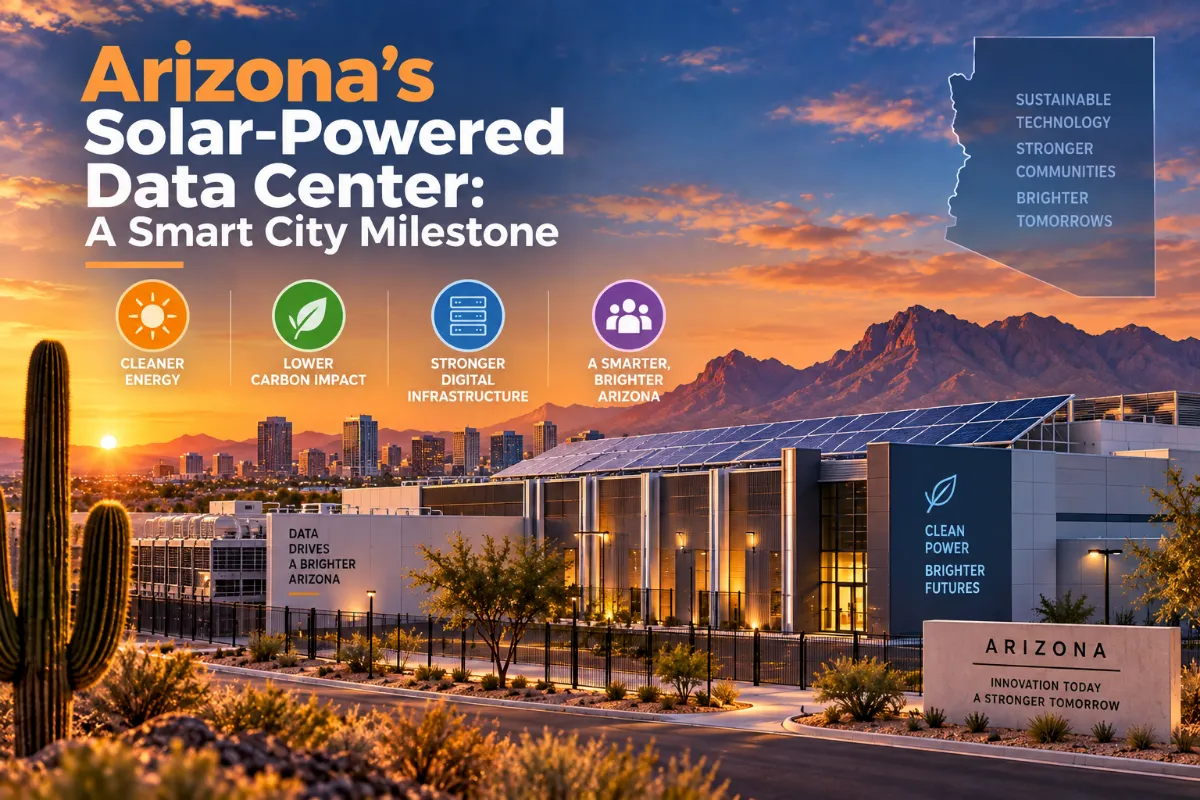
Arizona's Solar-Powered Data Center: A Smart City Milestone
 Smart Cities
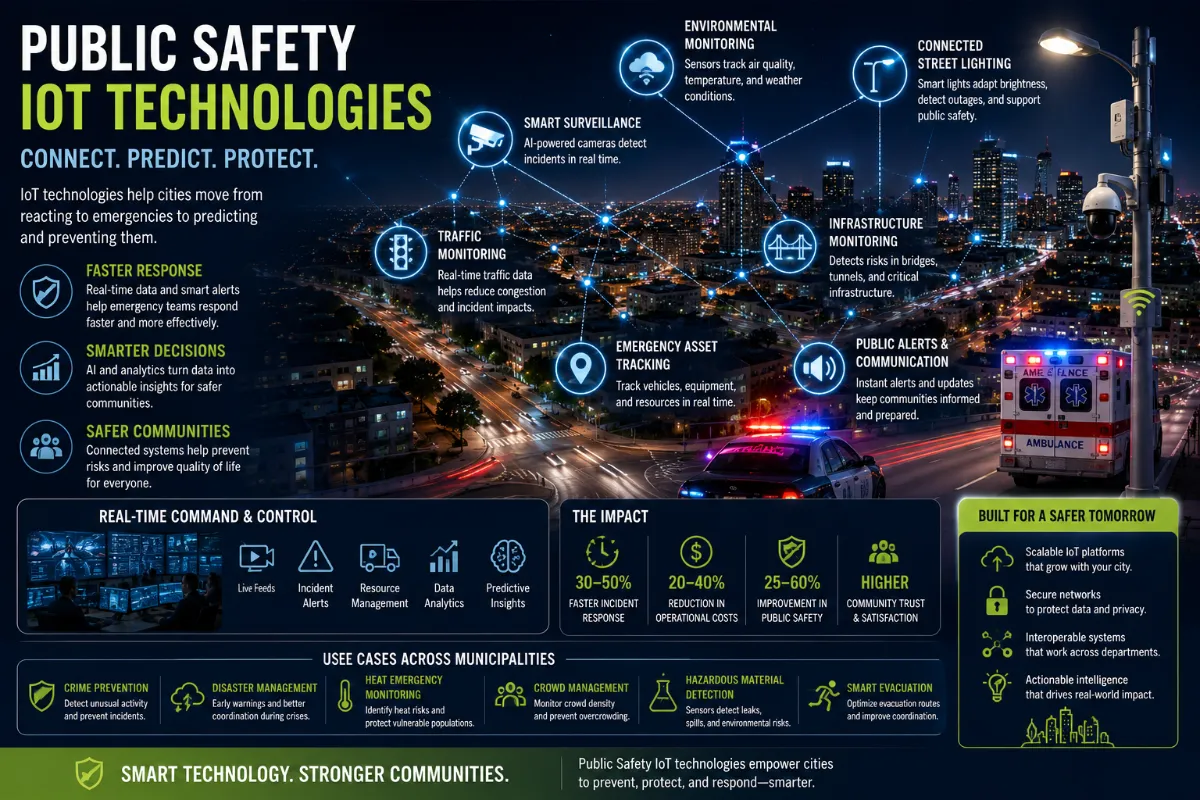
Public Safety IoT Technologies: How Cities Are Moving from Emergency Response to Predictive Protection
 Smart Cities